Trophy provides a core set of primitives to help you ship gamification experiences faster. But gamification is not something you can set and forget. A key part of running a gamified platform is experimentation — tweaking and optimizing the user experience to ensure that users keep coming back. Usually, you’d have to build these tools yourself, but with Trophy you get a simple experimentation stack out-of-the-box.Documentation Index
Fetch the complete documentation index at: https://trophy-mintlify-eb9158bd.mintlify.app/llms.txt
Use this file to discover all available pages before exploring further.
Control Ratio
Trophy has a built-in capability to automatically A/B test gamification features using a control ratio. Found on the integration page of the Trophy dashboard, the control ratio adjusts the percentage of users that are assigned to the ‘control’ group versus the ‘experimental’ group.control attribute as true or false in most APIs that relate to user data allowing you to conditionally show gamification features to users who are in the experimental group.
If you plan to measure the overall impact of gamification features, make sure to only show those features to users with control set to false.
The control attribute
Trophy also doesn’t send any Emails or Push
Notifications to users who are in the control
group.
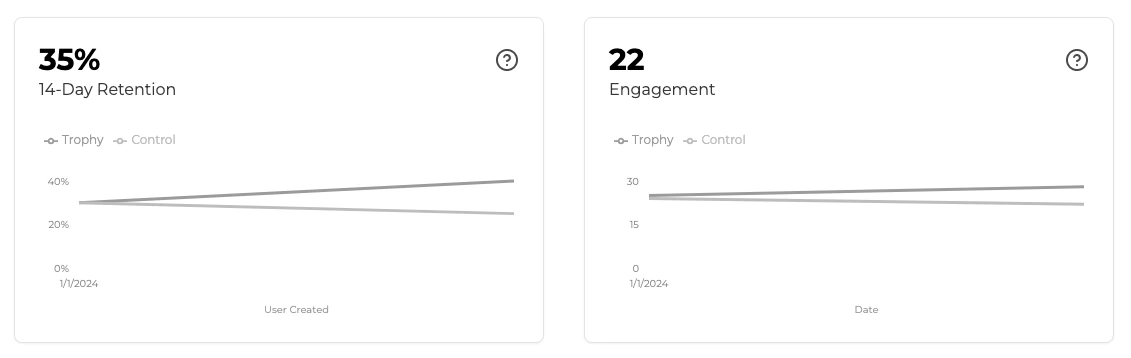
What Is Retention?
User retention is the percentage of users who are still using your product after a certain period. Common time frames include 7-day, 14-day and 30-day retention with shorter time frames providing information on initial user experience and longer time frames giving insight into long-term product-market fit.Retention Analytics
Trophy includes a retention chart for each metric on its metric dashboard and an aggregate user retention chart on the main dashboard.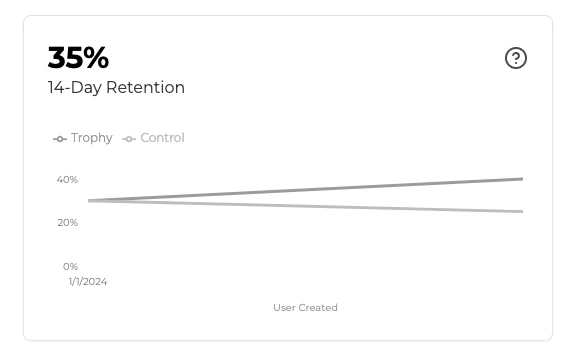
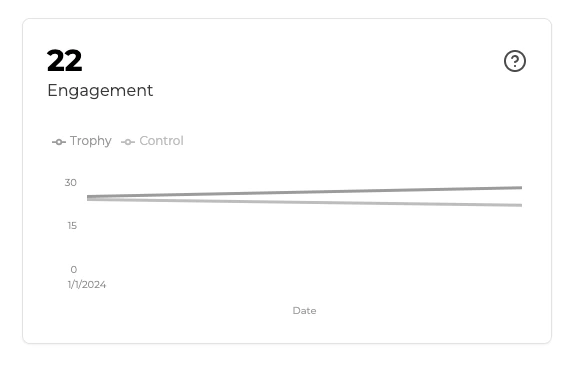
What Is Engagement?
User engagement in Trophy refers to the average level of activity that your users show when using your product. As Trophy tracks user interactions through Metrics, it can give you insights into how active your users are against each, and in aggregate. User engagement in Trophy is the average total metric event value per daily active user. The formula is:Engagement Analytics
Trophy dashboards for each metric show engagement charts for that metric, and the main Trophy dashboard presents user engagement in aggregate.